Sifting through data as an individual who is only interested in the big picture is daunting. Infographics are a great way to display data in a visually appealing fashion that attracts the eye. However, sometimes one static image, or a series of images, does not do the data justice. This is where interactive infographics can come in handy.


Interactive infographics allow their creators to showcase the most important facets of knowledge, while allowing users to delve deeper into the facts as they so desire. My project aims to make one of these real from a set of reputable data.


I am a self-proclaimed data geek, especially when it comes to consumer insights, so although the technical side of this project will be a learning experience for me, the content side would be a dream come true. The final desired result would be a fully functional interactive infographic that allows users to click to discover different layers and have this platform housed on the web.


How could we make this static infographic come to life?


Project Deliverables

The project would consist of two parts:

  • Website utilizing html and css to display the interactive infographics


  • Data visuals created using GIMP, Photoshop, or a similar program

Assignment Organization

I will need to fill the following roles to make my project a success:

  • 2 Web Developers: The Web Developers will make the interactive infographic run on the web using html and css (and potentially even Java Script).
  • 2 Visual Creators: The Visual Creators will design the visuals that bring the data to life.

Data Pool and Similar Projects

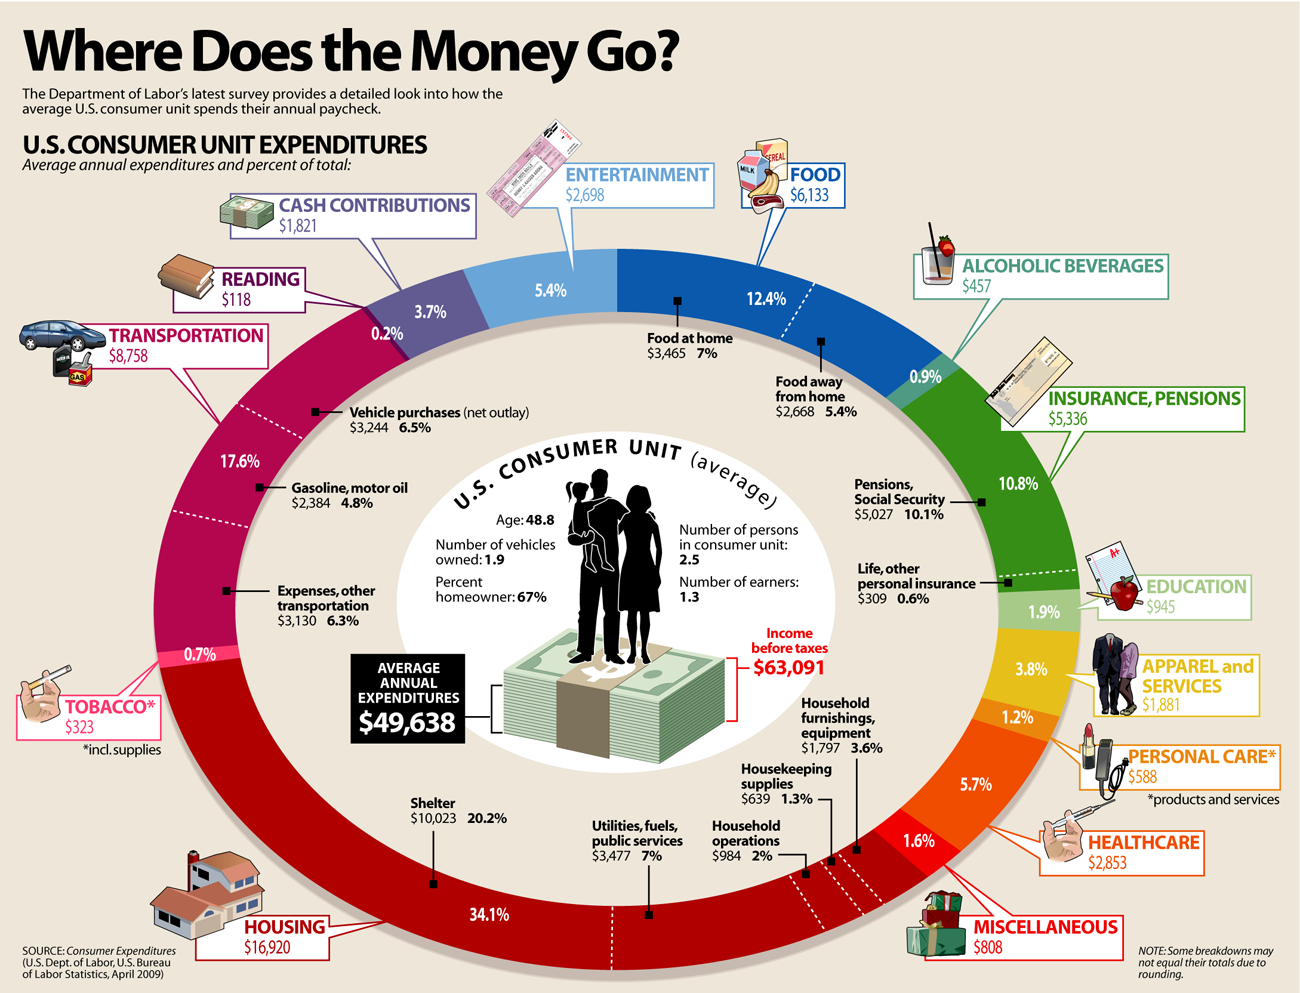
We could use the data from this site for our infographic: BLS Consumer Expenditure Report

And, these are some projects that aided in my inspiration: Fantastic Interactive Infographics You'll Love